ProcessView™
POP +AI
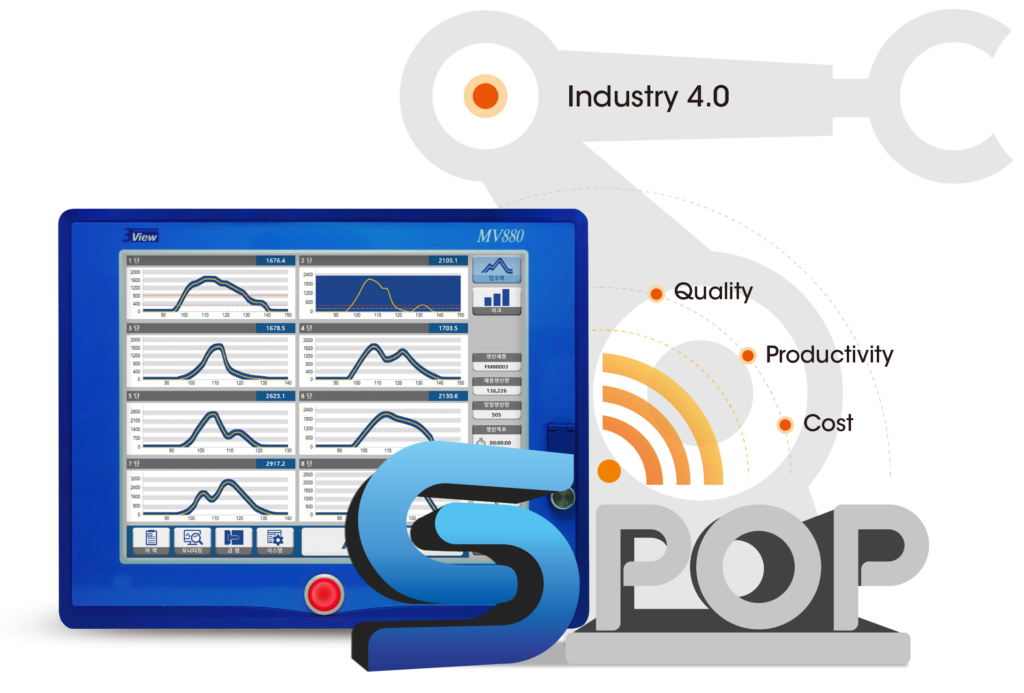
Production point management system that grasps production data on site in real time
*AI : Data from Force , AE(Acoustic Emission ) Acceleration sensors
ProcessView™ POP +AI
Production point management system that grasps production data on site in real time *AI : Data from Force , AE(Acoustic Emission ) Acceleration sensors
l Customer needs
Planning is difficult because production data is not captured in real time.
It is difficult to cope with urgent orders.
Real-time quality control in the field does not work properly.
They want to grasp machine efficiency to solve problems and reduce costs.
They want to know the real-time factory status and monthly production plans all at once at the office.
At the 1st. step in production management starts with the
POP system.
l Characteristic

Real Time
Data from the machine can be collected in real time and viewed in one place at the same time. Various information such as real-time production performance, machine operation status, quality inspection, and joint judgment are provided, and the desired information can be printed on the situation room or site situation board.

4M Change
By applying 4M (Man, Machine, Material, Method) change management for each process, it is possible to record and manage who produced which product at which facility and when. By analyzing the causes of problems or defects through the preserved data, you can stabilize the process and eliminate the causes of quality problems.

OEE
It provides the function to check the real-time equipment operation status and past operation history. When the equipment is not operating, the reason for the non-operation can be entered to statistically analyze the cause of the shutdown. Integrated operational history and production performance data enable comprehensive machine efficiency analysis, contributing to productivity improvement and cost reduction.

Statistical process management
It provides analysis results of quality measurement data collected from field terminals using various analysis techniques such as X bar R chart. By tracking changes in quality factors, you can detect, respond to, or improve anomalies before they occur.
l 주요 기능
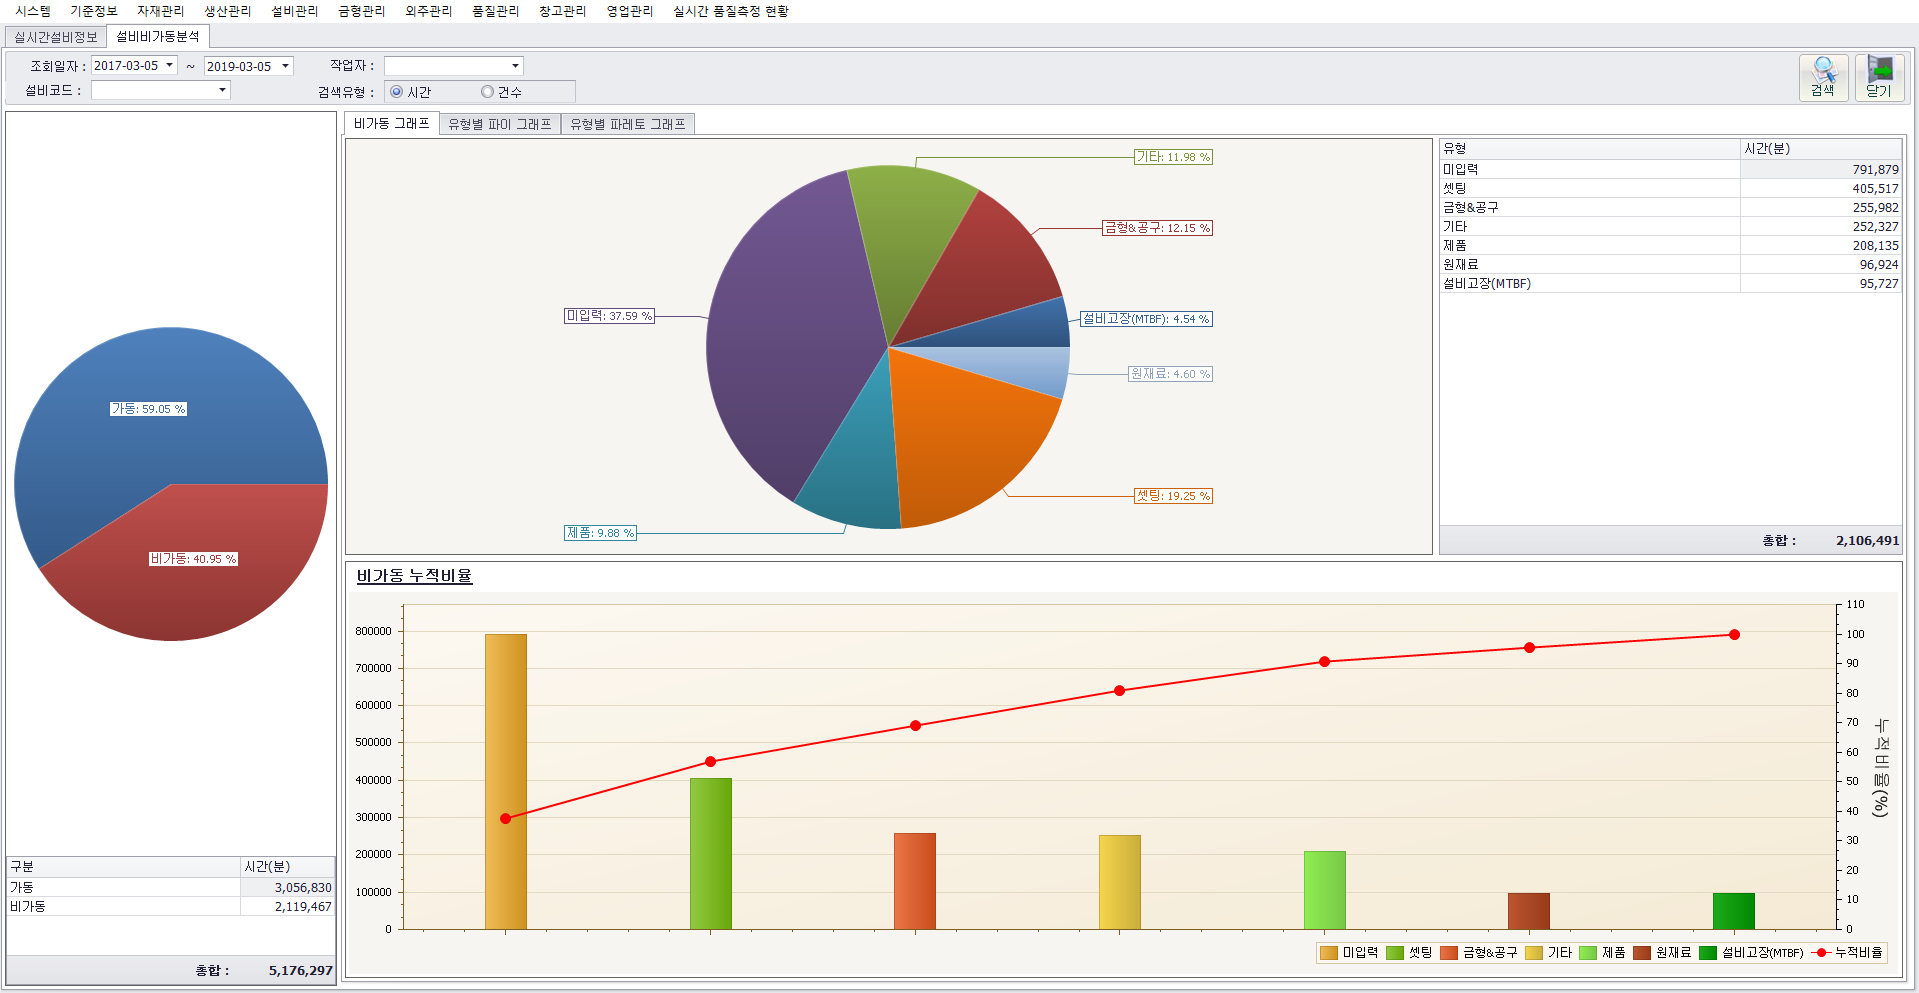
실시간 설비 가동 현황과 과거 가동 이력을 확인하는 기능을 제공합니다.
설비 비가동 시에는 비가동 사유를 입력하도록 하여, 어떤 원인으로 인해 가동이 중지되었는지 통계적으로 분석할 수 있습니다.
가동 이력과 생산 실적 데이터를 통합하여 설비 종합 효율 분석이 가능하여, 생산성 향상과 원가 절감에도 기여합니다.
각 설비의 데이터를 실시간으로 수집하여 한 곳에서 동시에 확인할 수 있습니다. 실시간생산 실적과 설비 가동 여부,
품질검사 실시 여부와 합부 판정 등 다양한 정보를 제공하며, 상황실 또는 현장 상황판에 원하는 정보를 출력할 수 있습니다.
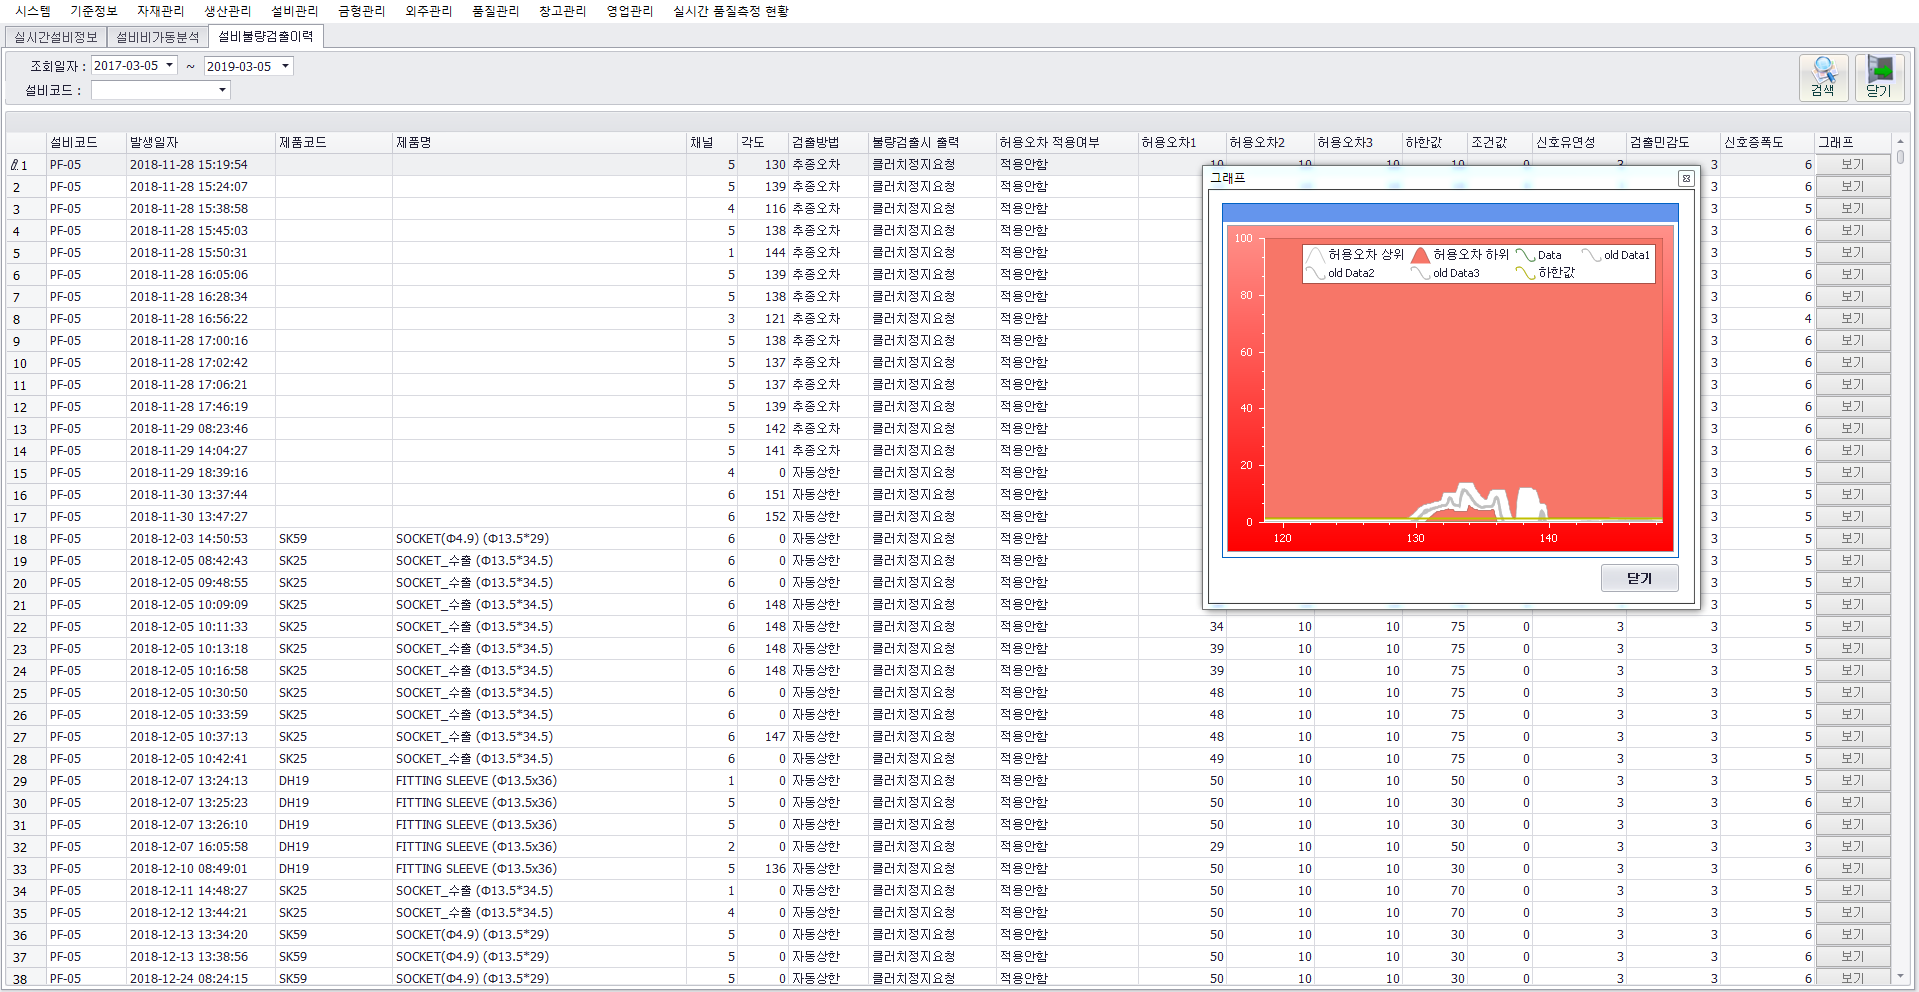
X bar R 관리도 등 다양한 분석 기법을 이용해 현장 단말기에서 수집한 품질 측정 데이터를 분석한 결과를 제공합니다.
품질 요인의 변화 추이를 추적하여, 불량이 발생하기 전에 미리 이상을 감지하고 대처하거나 개선할 수 있습니다.
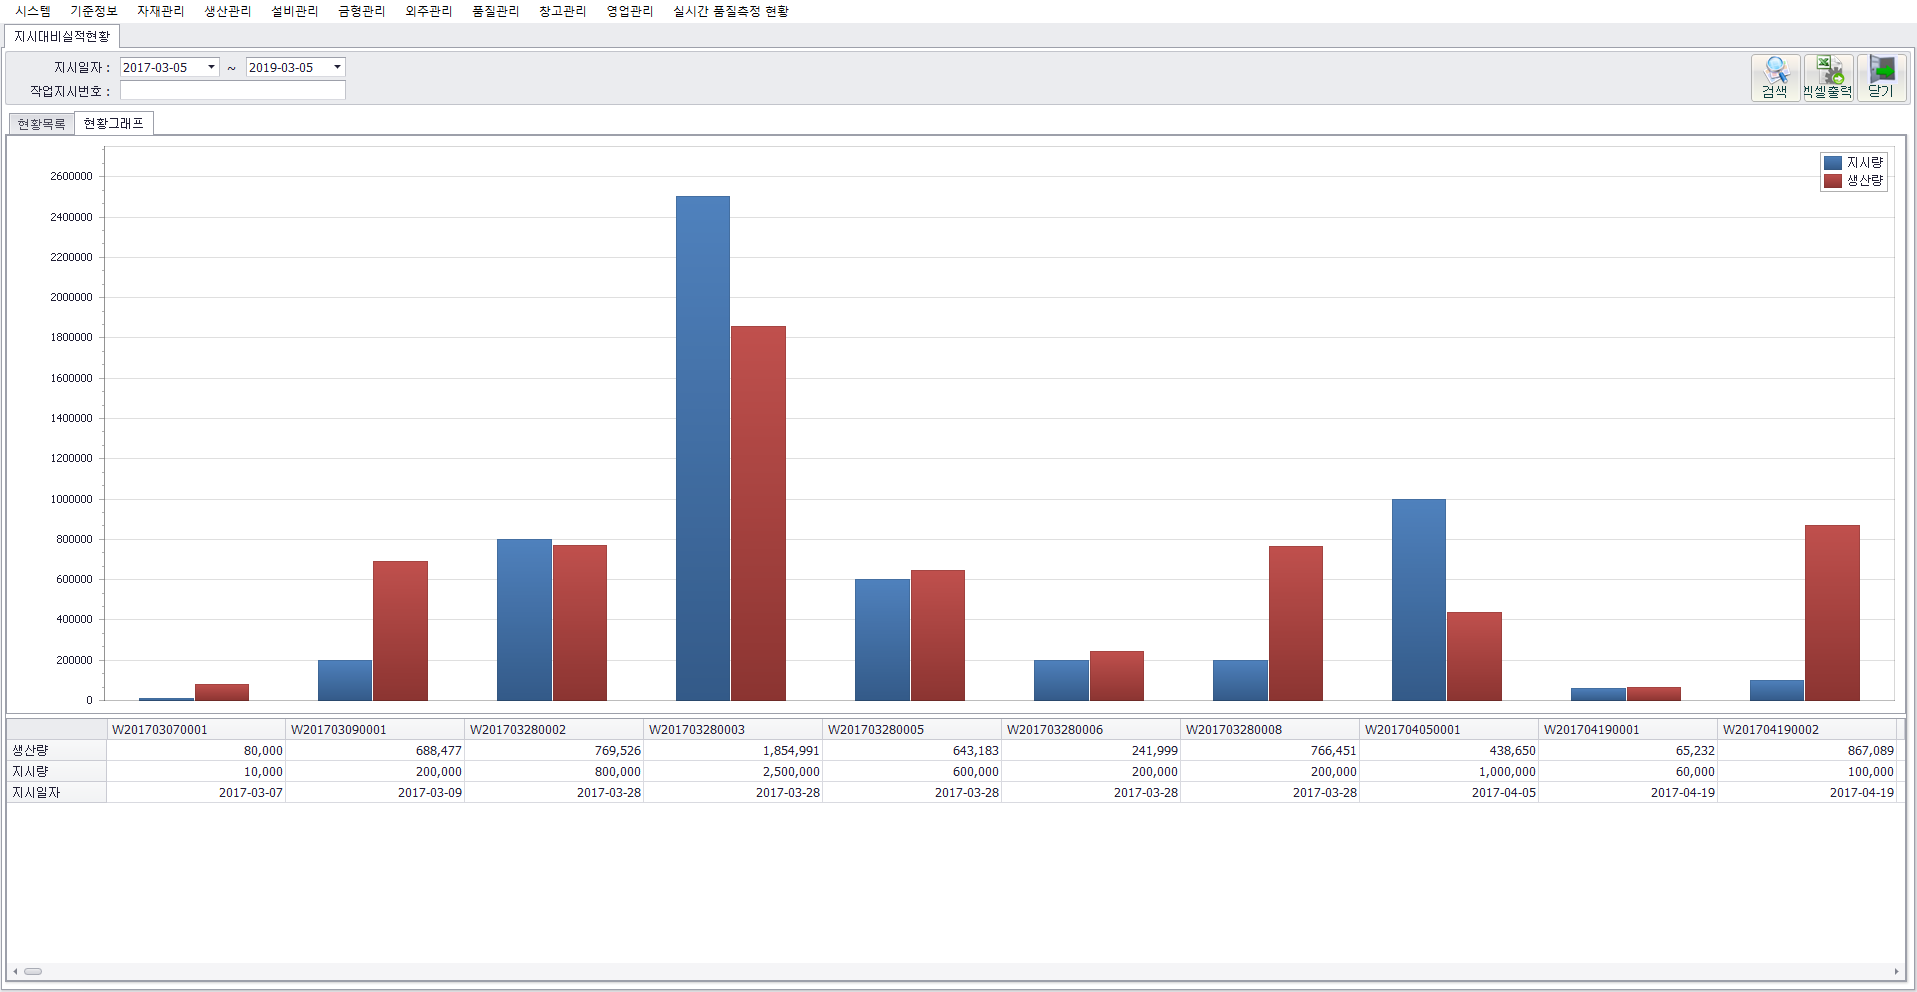
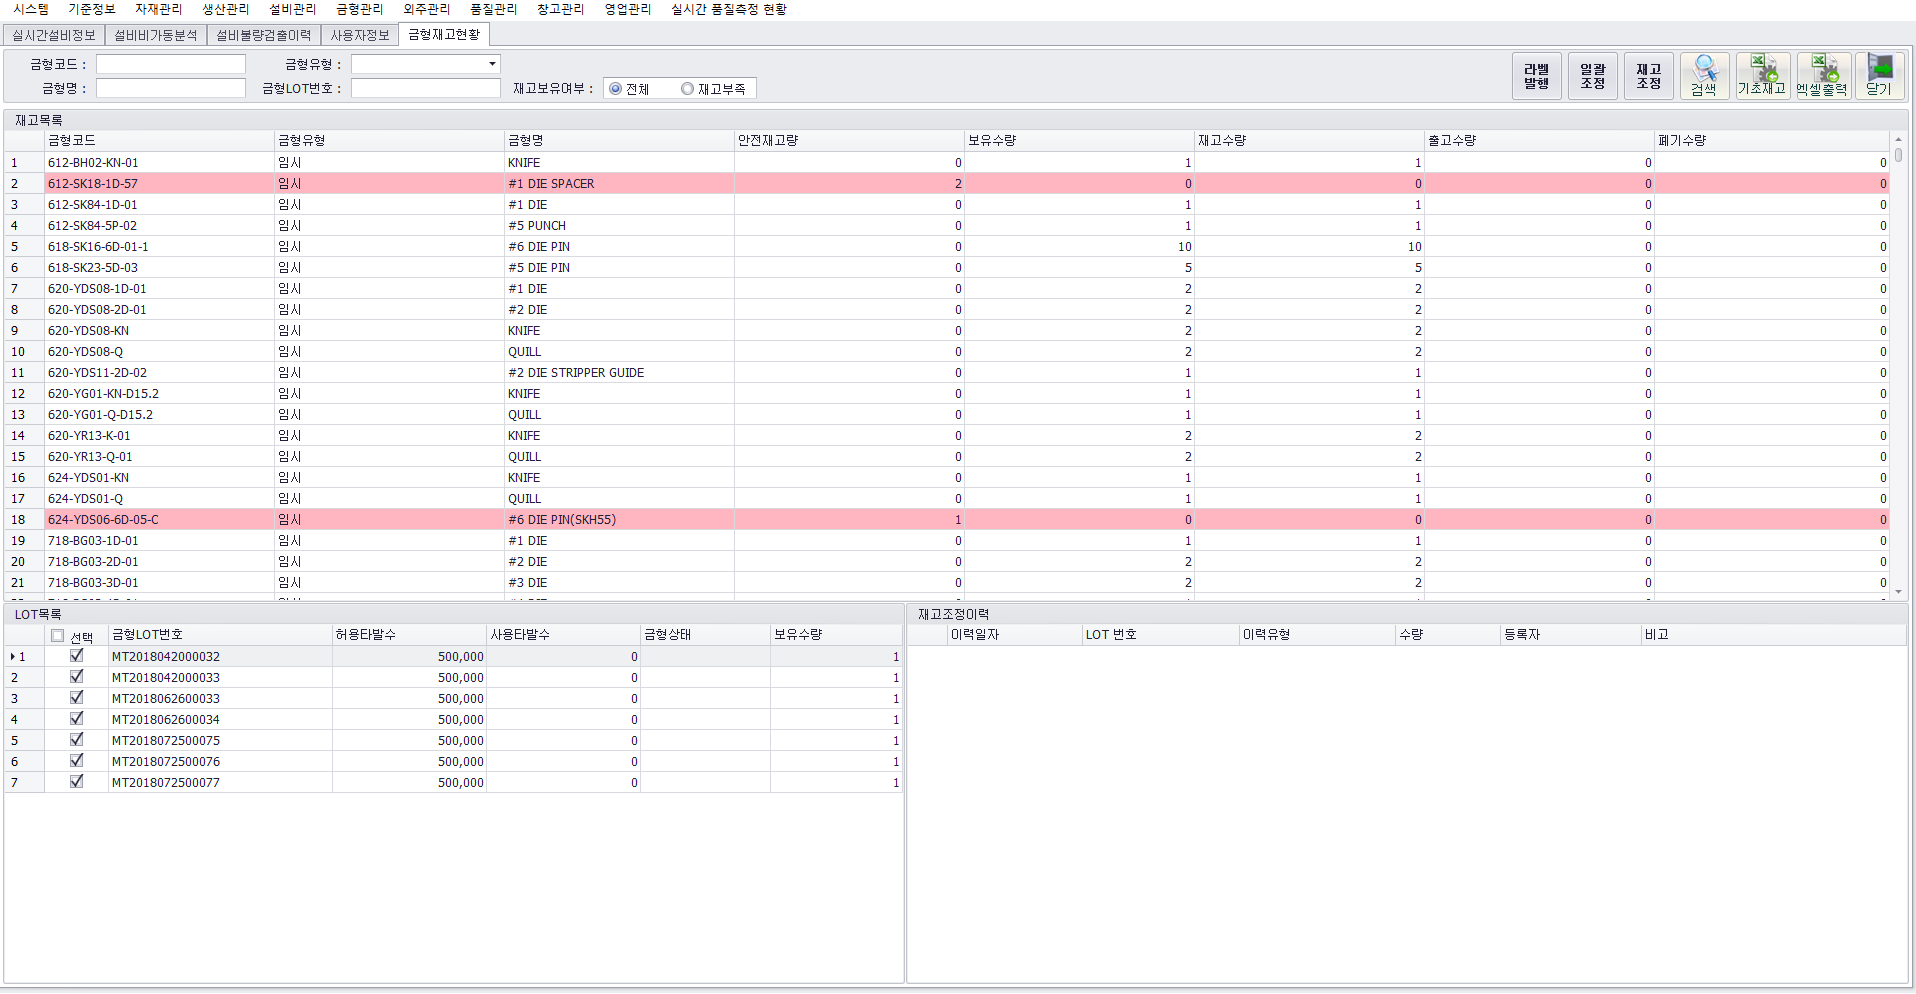
각 설비의 금형 사용량을 자동으로 계산하며, 설정한 수명에 다다르면 경고를 내보냅니다.
금형 교체 주기를 확인하고 평균 사용량 데이터를 축적하여, 금형 수명을 안정화하고 최대한으로 활용할 수 있도록 지원합니다.
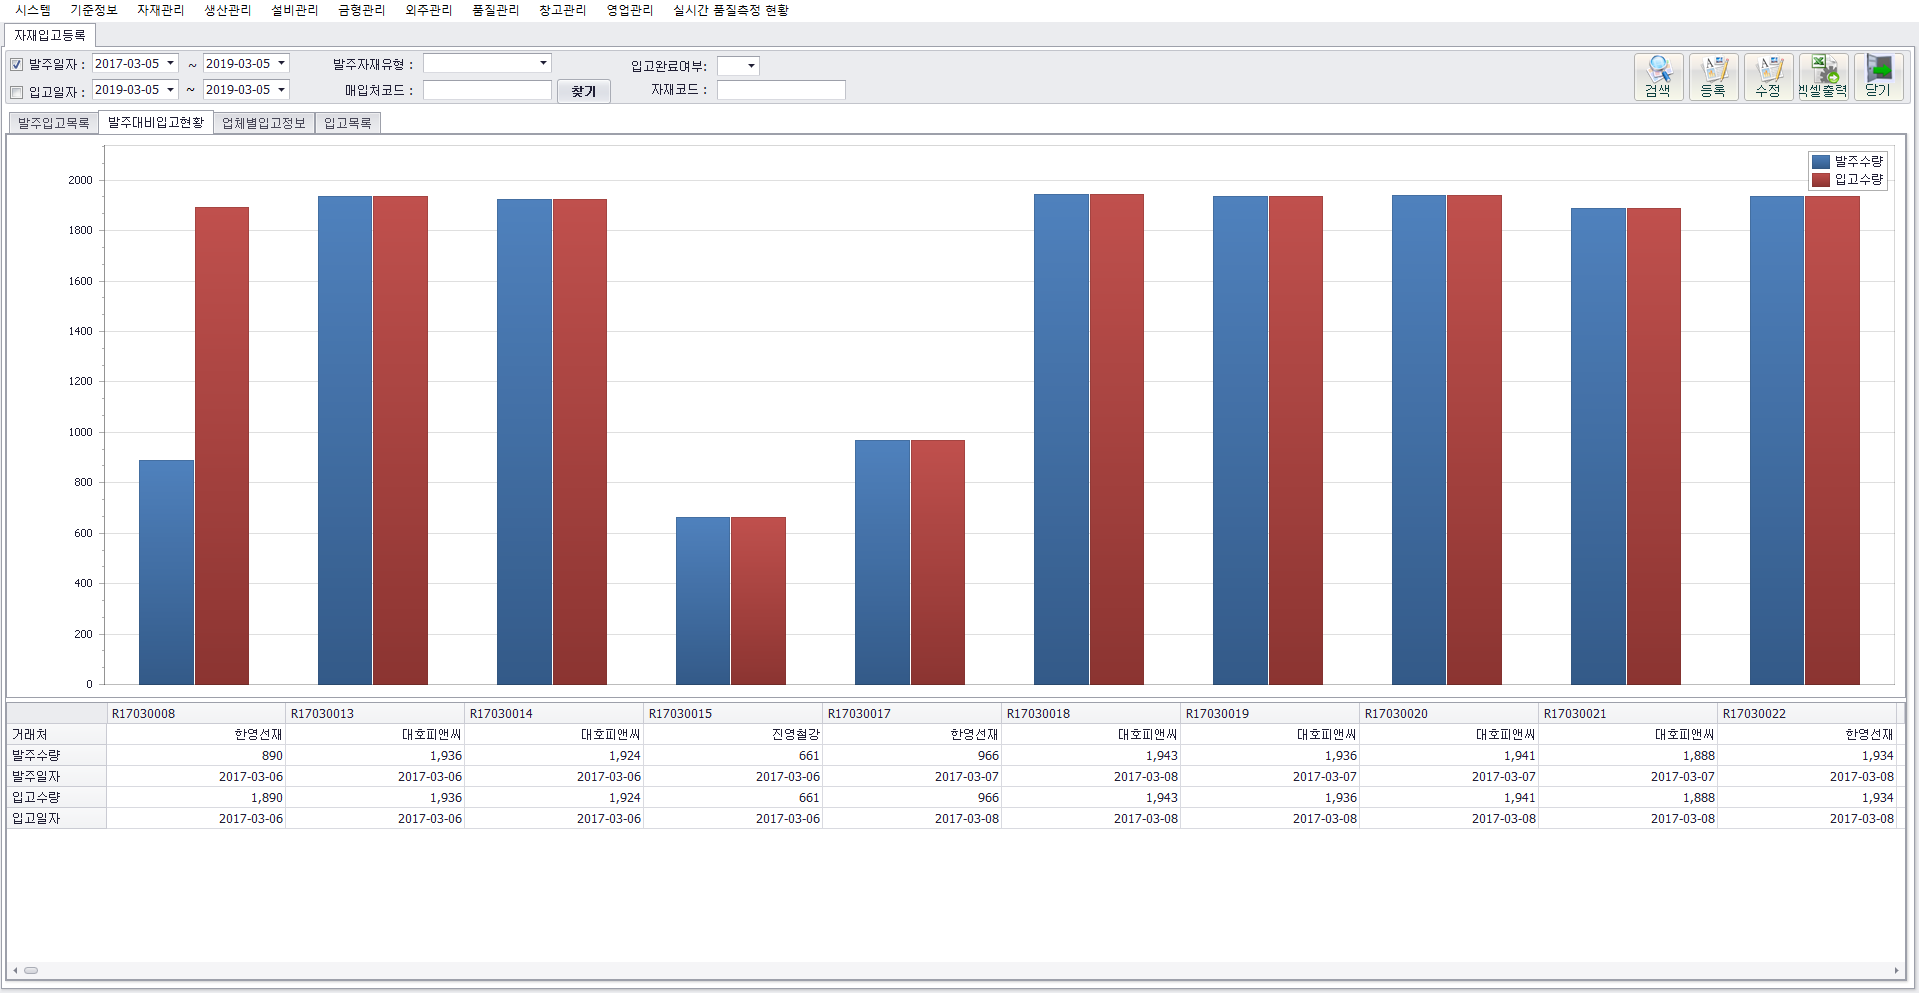
제품 BOM 정보, 생산 도면, 설비 점검 체크리스트 등의 생산 문서를 저장하여, 현장 단말기에서 언제든지 열람할 수 있습니다.
문서의 분실을 방지하고 즉시 확인할 수 있어, 현장에서 문서를 별도 보관하거나 찾는 데 들어가는 시간과 수고를 절감할 수 있습니다.
또한 손쉽게 형상 관리를 할 수 있어, 오래된 도면을 참조하거나 최신 도면을 착각하여 발생하는 오작업 등을 방지할 수 있습니다.